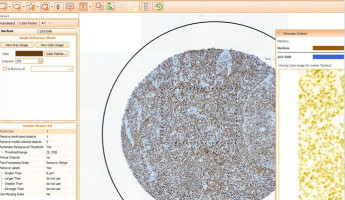
TissueQuest 4.0 is a new version which is much better integrated into the TissueFAXS System
workflow than anterior versions. The analysis paradigm is the same, however, so there is no need to
learn a completely new workflow.
Main features
·Completely new user interface which allows the user to see and navigate a zoomable digital slide.
·Regions of interest, annotations and exclusion regions, drawn onto this digital slide, allow for
greater precision and ease of analysis.
·Enhanced calculation speed due to better usage of multi-core computer workstations.
·Analysis of FISH and other “Dot in the Cell” data as mRNA, displaying results in Pathology-oriented list view, export to Excel.
·Import scan projects from Mirax and Pannoramica line scanners and analyze them in TissueQuest
·Load more samples of the same type into the analysis project, use analysis templates and profiles
to re-use proven settings.
·Use of Calculated Parameters to measure ratios and the Percentile measurement parameter for
intensely stained within the Measurement Mask.
·Three data export modes (Print Report, Raw Data list, Statistic Report).
·Compare Sets for side by side or overlay graphic data comparison.
·Comparative analyses of consecutive sections with different markers on the same tissue areas
using Image Compare Sets.
·Fully controllable colour and thickness of all contours on the images.
·Full TMA support for fast analysis with comprehensive data export.
Modularity
TissueGnostics has made major efforts to equip its users with Software that is tailored to their needs.
As the final result TissueQuest 4.0 is modularized. Taking into consideration the different applications
of image analysis software around the globe, TissueGnostics defined 6 module-packages:
·Module 1 - Histology
·Module 2 - Nuclear Counting
·Module 3 - Cells & Cytoplasm
·Module 4 - Diagnostics
·Module 5 - Diagnostics Xtended
·Module 6 - TMA
Histology Module
This entry module provides the capability to import original fluorescent gray-scale images from each
filter used and draw individualised regions of interest (ROI's) to measure stained areas in a sample.
It also features an annotation tool. Data display is in histograms and raw data can be exported to
Excel or PDF.
Stand-alone or incombination with any other module
Nuclear Counting Module
Similar to the histology module, the nuclear counting module additionally allows users to quantify
stained nuclei and measure several analytical parameters, such as area and staining intensity of
nuclei.
Basic module for the modules 3 to 5
Cells & Cytoplasm Module
This module adds more cell-structured analysis to the entry modules: ring mask around the nucleus
and cell mask detection of cytoplasmatic markers is available through a growth algorithm. Data can
now also be displayed in scattergrams.
Add-on to anterior modules
Diagnostics Module
This module additionally provides virtual channels for comparative measurements in nuclear versus
cytoplasmatic compartments and a report generator. Compare sets allow the graphical comparison
of diagrams. Tools such as a ruler and a scale bar make exact sample measurements possible.
Propagation & grouping of ROI's makes analysis of consecutive cuts simpler and faster.
Add-on to anterior modules
Diagnostics Xtended
The entire features and capabilities (excluding TMA analysis) of the Software are provided: in addition
to the diagnostics module, further automation is possible using a cutoff suggestion for the separation
of positive and negative populations in the diagrams. Scattergram and histogram results can be
controlled visually by using the forward and backward connection in conjunction with the images.
Images can now also be imported from specific scanners and be compared using the multi-sample-viewer. A manual correction tool allows manipulation of the identified nuclei and specified regions
can be excluded from analysis. Finally, ROI's and annotations can be produced quicker and more
extensively with the easy-ROI tool.
Add-on to anterior modules
TMA Module
This module provides full analysis capabilities including Tissue Microarrays. TMA scanning projects
from the TissueGnostics product line TissueFAXS/HistoFAXS can be imported with each spot, block
or slide already identified and named. The spots in TMA images from other systems can be identified
with several features, allowing for automatic detection or manual selection.
Add-on to any other module
TissueQuest - Cell Analysis Software
TissueQuest is the first software solution worldwide to identify and analyze individual cells in their
native tissue environment. It supports any number of fluorescent markers used for this purpose.
Cell identification is not confined to isolated cells. TissueQuest also identifies cells that are
agglomerated in dense clusters or have been reduced to ring structures (as is typical of cancer cells).
With Tissue Quest, we offer our customers a unique diagnostic tool. This is the first time that tissue
can be mapped and analyzed in a truly objective and reproducible manner.
Regardless of the type and density of cells involved, TissueQuest recognizes their nuclei due to
patented image processing algorithms.By combining specific stainings and algorithms, one can
measure staining intensities that are specific for various cell types.TissueQuest can be used as
stand alone application.
Cells are clearly distinguished even:
·in solid tissue structures
·if embedded in clusters
·if nuclei are uniformly stained
·if staining involves ring structures


